Every Deadlock patch reshuffles the meta, and by the time a static tier list image makes the rounds on Reddit, three heroes have already moved. Valve’s hero shooter is still in invite-only playtest as of August 2026, which means balance changes land often and fast. If you’re tired of screenshotting someone else’s opinion, you can build your own ranking engine instead.
This tutorial walks through a Python script that takes hero stats (win rate, pick rate, and kill participation), runs them through a weighted formula, and outputs both a JSON ranking file and a shareable PNG tier list image. Wire it into a GitHub Action and it regenerates itself every time you update the numbers, no manual dragging required. For more competitive gaming breakdowns, check our esports coverage.
What You’ll Build
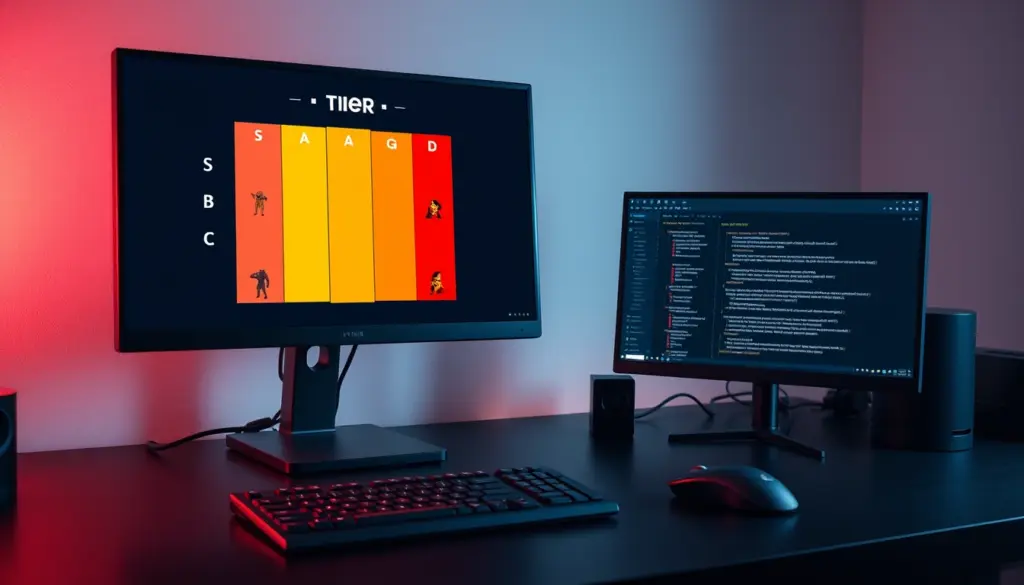
By the end of this tutorial you’ll have a command-line tool, deadlock-tiergen, that reads a CSV or JSON file of hero stats for all 38 heroes currently in the playtest, computes a composite score for each one, sorts them into five tiers (S through D), and renders the result as a PNG you can post directly. A GitHub Actions workflow then runs the script automatically and commits the refreshed image whenever you push new patch data.
This is a different approach from a manual tier board like our Deadlock Tier List Tracker or a community-vote system like our Deadlock Tier List Voting App. Nothing gets dragged by hand here and nobody clicks a vote button. You feed the script numbers, it does the ranking math, and the output is reproducible. Run it twice on the same data and you get the same tier list every time, which matters when you’re debating a ranking with someone on Discord.
Why an Automated Generator Beats a Manual Tier List
Manual tier lists are opinions dressed up as data. Someone ranks 38 heroes by feel, maybe cross-references a stat site, and publishes a static image that’s already stale by the next patch. An automated generator flips that order. You decide the formula once, then let the numbers speak for a given patch, and the ranking updates the moment fresh data comes in.
That matters more for Deadlock specifically than it would for a fully released game with yearly seasons. Valve pushes balance changes at a fast clip, and playtest-only status means the meta can shift meaningfully between two Tuesday patches. A manual list you update once a month is already behind by the time anyone reads it. A script that runs on every data push isn’t.
There’s a debugging argument for this approach too. When two people argue about whether a hero belongs in A or B tier, a documented formula and a git history of exactly what changed and when settles it faster than two competing screenshots. You can point at the commit that moved a hero and the exact stat delta that triggered it, something a manually curated list can’t offer no matter how confident the person behind it is.
None of this makes community consensus or hands-on drag-and-drop rankings the wrong tool for other jobs. A vote-based board like our Tier List Voting App captures what a playerbase actually believes, which a formula can’t measure. This generator captures something narrower and more mechanical: a specific, reproducible read of whatever numbers you feed it.
Prerequisites and Tools You’ll Need
- Python 3.12 or newer (3.11 also works)
- Pillow 10.x, installed via pip, for image rendering
- pytest, for the unit test step
- A code editor such as VS Code
- Git and a free GitHub account, needed for the automation steps
- About 45 minutes
- No Deadlock account or game install required, though knowing the hero names helps if you extend the roster later
The Current Deadlock Meta: Patch 08-12-2026 Snapshot
Deadlock’s playtest roster sits at 38 heroes as of the Minor Update on August 12, 2026. Community trackers have Apollo and Vyper trending upward since that patch, while Billy and Wraith slipped after their kit adjustments. The table below is a sample input dataset, structured the way a win-rate export from a community tracker typically looks. Swap in live numbers from whichever source you trust and the script’s output updates on its own.
Deadlock blends a MOBA’s lane structure and souls-based economy with third-person shooter combat, and that hybrid design is part of why balance patches move the needle so much. A hero’s win rate isn’t purely about individual mechanical skill. It also reflects itemization choices, lane matchups, and how a kit scales through the souls economy as a match runs long. A single win-rate number, taken alone, is a thin signal for any of that. The formula built in this tutorial blends in pick rate and kill participation specifically to reduce the risk of one lucky string of games skewing a hero’s ranking for an entire patch cycle.
| Hero | Win Rate | Pick Rate | Composite Score | Generated Tier |
|---|---|---|---|---|
| Apollo | 54.8% | 11.2% | 0.81 | S |
| Vyper | 53.9% | 9.6% | 0.77 | S |
| Abrams | 52.1% | 14.3% | 0.71 | A |
| Ivy | 51.4% | 8.9% | 0.68 | A |
| Paradox | 50.2% | 7.5% | 0.61 | B |
| McGinnis | 49.8% | 6.1% | 0.58 | B |
| Wraith | 47.6% | 5.4% | 0.49 | C |
| Billy | 46.9% | 4.8% | 0.46 | C |
| Mo & Krill | 45.1% | 3.9% | 0.41 | D |
| Warden | 44.3% | 3.2% | 0.38 | D |
Step 1: Set Up Your Project Environment
Create a project folder and a virtual environment so Pillow and pytest don’t collide with anything else on your machine.
mkdir deadlock-tiergen
cd deadlock-tiergen
python3 -m venv .venv
source .venv/bin/activate
pip install pillow pytest
mkdir data output
On Windows, activate the virtual environment with .venv\Scripts\activate instead. The data folder holds your hero stats CSV, and output is where the generator writes the PNG and JSON files.
Step 2: Define the Hero Roster and Data Model
Create models.py with a small dataclass for a hero record and a loader that reads your stats CSV. Keeping the data model separate from the scoring logic makes both easier to test later.
import csv
from dataclasses import dataclass, field

@dataclass
class Hero:
    name: str
    win_rate: float
    pick_rate: float
    avg_kills: float
    score: float = field(default=0.0)
    tier: str = field(default="")

def load_heroes(csv_path: str) -> list[Hero]:
    heroes = []
    with open(csv_path, newline="", encoding="utf-8") as f:
        for row in csv.DictReader(f):
            heroes.append(Hero(
                name=row["name"].strip(),
                win_rate=float(row["win_rate"]),
                pick_rate=float(row["pick_rate"]),
                avg_kills=float(row["avg_kills"]),
            ))
    return heroes
Note the .strip() on the name field. A trailing space in a CSV export is a common source of duplicate-looking heroes further down the pipeline, and it’s cheaper to fix here than to debug later.
Step 3: Score Heroes With a Weighted Formula
Raw percentages don’t compare well across metrics with different ranges, so normalize each stat to a 0-1 scale before weighting it. Win rate gets the heaviest weight because it’s the most direct signal of a hero’s current strength. Pick rate comes second, since a hero nobody plays is easy to overrate on a small sample. Kill participation acts as a tie-breaker.
def normalize(values: list[float]) -> list[float]:
    lo, hi = min(values), max(values)
    span = hi - lo or 1.0
    return [(v - lo) / span for v in values]

def score_heroes(heroes: list) -> None:
    win = normalize([h.win_rate for h in heroes])
    pick = normalize([h.pick_rate for h in heroes])
    kills = normalize([h.avg_kills for h in heroes])

    for hero, w, p, k in zip(heroes, win, pick, kills):
        hero.score = round(0.5 * w + 0.3 * p + 0.2 * k, 3)
The span = hi - lo or 1.0 line prevents a division-by-zero error if every hero in your dataset happens to share the same value for a stat, which can happen with a very small sample early in a patch cycle.
The 0.5 / 0.3 / 0.2 split isn’t the only reasonable choice, and it shouldn’t be treated as gospel. Someone building a ranking for a coordinated five-stack might weight kill participation and objective control higher, since raw win rate in solo queue reflects a lot of noise from mismatched skill levels on both teams. Someone tracking a support-focused subset of heroes might drop win rate’s weight and lean on assist-style metrics instead, if your data source tracks them. The formula in Step 6 exposes these as a --weights flag for exactly this reason: the “right” weighting is a judgment call about what you’re trying to measure, not a fixed constant.
Step 4: Auto-Assign Tiers From Scores
Rather than hardcoding score thresholds, compute tier boundaries from percentiles. This way the same code works whether you’re ranking 38 heroes today or 45 after Valve ships a few more.
import statistics

TIER_LABELS = ["D", "C", "B", "A", "S"]

def assign_tiers(heroes: list) -> None:
    scores = sorted(h.score for h in heroes)
    cut_points = statistics.quantiles(scores, n=5)

    for hero in heroes:
        idx = sum(hero.score > c for c in cut_points)
        hero.tier = TIER_LABELS[idx]

    heroes.sort(key=lambda h: h.score, reverse=True)
statistics.quantiles needs at least two data points and behaves oddly on very small lists, which is worth remembering if you ever test this against a filtered subset of heroes rather than the full roster.
Step 5: Render the Tier List as a PNG With Pillow
Now draw the actual image. Each tier gets a colored row, and hero names are placed left to right inside it. Pillow ships with a built-in default font, which is what keeps this step working the same way on your laptop and inside a headless CI runner.
from PIL import Image, ImageDraw, ImageFont

TIER_COLORS = {
    "S": (230, 70, 70), "A": (235, 150, 60),
    "B": (230, 210, 60), "C": (120, 190, 90), "D": (110, 140, 220),
}

def render_tierlist(heroes: list, out_path: str, row_h: int = 90, width: int = 1200) -> None:
    rows = {t: [] for t in TIER_LABELS}
    for h in heroes:
        rows[h.tier].append(h.name)

    img = Image.new("RGB", (width, row_h * 5), (20, 20, 24))
    draw = ImageDraw.Draw(img)
    font = ImageFont.load_default(size=22)

    for i, tier in enumerate(reversed(TIER_LABELS)):
        y = i * row_h
        draw.rectangle([0, y, 140, y + row_h], fill=TIER_COLORS[tier])
        draw.text((50, y + 30), tier, fill=(0, 0, 0), font=font)
        names = "   ".join(rows[tier]) or "(none)"
        draw.text((160, y + 30), names, fill=(240, 240, 240), font=font)

    img.save(out_path, optimize=True)
The optimize=True flag on save is easy to skip and produces a noticeably larger file, which matters once you’re committing an updated PNG on every patch.
Step 6: Build the CLI Entry Point and JSON Export
Tie the pieces together in main.py, and write a JSON file alongside the image so other tools (a Discord bot, a static site, a spreadsheet import) can consume the rankings without parsing pixels.
import argparse, json
from models import load_heroes
from scoring import score_heroes, assign_tiers
from render import render_tierlist

def main():
    parser = argparse.ArgumentParser()
    parser.add_argument("--input", default="data/heroes.csv")
    parser.add_argument("--out-dir", default="output")
    args = parser.parse_args()

    heroes = load_heroes(args.input)
    score_heroes(heroes)
    assign_tiers(heroes)

    render_tierlist(heroes, f"{args.out_dir}/tierlist.png")
    with open(f"{args.out_dir}/rankings.json", "w") as f:
        json.dump([h.__dict__ for h in heroes], f, indent=2)

    print(f"Ranked {len(heroes)} heroes -> {args.out_dir}/tierlist.png")

if __name__ == "__main__":
    main()
Step 7: Write Unit Tests for the Scoring Logic
The scoring math is the part most likely to break silently, so it deserves actual tests, not just eyeballing the output. Save this as test_scoring.py.
from models import Hero
from scoring import score_heroes, assign_tiers

def make_heroes():
    return [
        Hero("A", win_rate=60, pick_rate=10, avg_kills=8),
        Hero("B", win_rate=50, pick_rate=5, avg_kills=6),
        Hero("C", win_rate=40, pick_rate=2, avg_kills=4),
    ]

def test_scores_are_bounded():
    heroes = make_heroes()
    score_heroes(heroes)
    assert all(0.0 <= h.score <= 1.0 for h in heroes)

def test_highest_stats_get_top_tier():
    heroes = make_heroes()
    score_heroes(heroes)
    assign_tiers(heroes)
    assert heroes[0].name == "A"
Run it with pytest -q. If a future change to the weighting formula flips the top hero unexpectedly, this is the test that catches it before the CI job commits a wrong image.
Testing the Full Pipeline Locally
Before wiring anything into CI, run the whole thing by hand against the sample dataset and confirm the output actually looks right.
python main.py --input data/heroes.csv
open output/tierlist.png       # macOS
start output\tierlist.png      # Windows
xdg-open output/tierlist.png   # Linux
Open the PNG and check three things: every hero appears exactly once, the S-tier row isn't suspiciously empty or suspiciously full, and the JSON file's hero count matches your CSV's row count. A common failure here is an off-by-one in a custom CSV export that drops the final row or, worse, duplicates the header row as a hero literally named "name." Catching that locally, with a file you can eyeball, is a lot faster than catching it three commits deep into a CI log where the only symptom is a tier list with 37 heroes instead of 38.
Step 8: Automate Generation With GitHub Actions
With the script working locally, wire it into a workflow that runs whenever you push new numbers to data/heroes.csv. Save this as .github/workflows/tierlist.yml.
name: Generate Deadlock Tier List
on:
  push:
    paths:
      - "data/heroes.csv"
  workflow_dispatch:

jobs:
  build:
    runs-on: ubuntu-latest
    steps:
      - uses: actions/checkout@v4
      - uses: actions/setup-python@v5
        with:
          python-version: "3.12"
      - run: pip install pillow pytest
      - run: pytest -q
      - run: python main.py
      - run: |
          git config user.name "tierlist-bot"
          git config user.email "[email protected]"
          git add output/
          git diff --cached --quiet || git commit -m "Update tier list [ci]"
          git push
The git diff --cached --quiet || guard is what stops the job from failing on runs where nothing actually changed, since git commit exits non-zero on an empty commit.
Step 9: Diff Tier Changes Between Patches
A tier list is more interesting when you can see what moved. Keep the previous run's JSON around and compare it against the new one.
import json

def diff_tiers(old_path: str, new_path: str) -> list[str]:
    old = {h["name"]: h["tier"] for h in json.load(open(old_path))}
    new = {h["name"]: h["tier"] for h in json.load(open(new_path))}
    changes = []
    for name, tier in new.items():
        if name in old and old[name] != tier:
            changes.append(f"{name}: {old[name]} -> {tier}")
    return changes
Store each run's JSON in a dated folder (history/2026-08-12.json) instead of overwriting it, so diff_tiers always has something to compare against on the next patch.
Step 10: Publish the Output to GitHub Pages
To share the tier list without asking people to clone a repo, enable GitHub Pages for the repository, pointed at a docs/ folder. Have the Action copy output/tierlist.png and a minimal index.html into docs/ as its last step, then commit alongside the rest. Pages picks up the change automatically on the next build, usually within a minute or two of the push.
Step 11: Add a Discord Webhook Notification
If your group chats about tier movement anyway, have the script tell you when something changes instead of waiting to notice.
import os, requests

def notify_discord(changes: list[str]) -> None:
    if not changes:
        return
    webhook = os.environ["DISCORD_WEBHOOK_URL"]
    content = "**Deadlock tier list updated:**\n" + "\n".join(changes)
    requests.post(webhook, json={"content": content}, timeout=10)
Store the webhook URL as a GitHub Actions secret, never as a plain string in the workflow file, and reference it as secrets.DISCORD_WEBHOOK_URL when you pass it into the job's environment.
Step 12: Version and Tag Each Generated Tier List
Name each output file with the patch date, not a generic tierlist.png, so old rankings stay browsable instead of being silently overwritten. A simple convention works fine: output/tierlist-2026-08-12.png plus a latest.png copy that your Pages site actually embeds. Six months from now, being able to pull up exactly what the meta looked like the week a specific patch shipped is worth the extra file.
This habit pays off the first time someone asks why a hero dropped two tiers and you can hand them tierlist-2026-07-15.png next to tierlist-2026-08-12.png instead of trying to reconstruct the old ranking from memory. It also turns your history/ folder into a small, self-maintained archive of the Deadlock meta, which is a more durable record than a Reddit thread that gets buried within a week.
Example Output: What the Generator Produces
$ python main.py --input data/heroes.csv
Ranked 38 heroes -> output/tierlist.png
$ python -c "from diff import diff_tiers; print(diff_tiers('history/2026-07-15.json','output/rankings.json'))"
['Apollo: A -> S', 'Vyper: A -> S', 'Wraith: B -> C', 'Billy: B -> C']| Hero | Previous Tier | New Tier |
|---|---|---|
| Apollo | A | S |
| Vyper | A | S |
| Wraith | B | C |
| Billy | B | C |
Common Pitfalls to Avoid
- Normalizing on raw percentages instead of min-max scaling. A hero with a 60% pick rate will otherwise dominate the score even with a mediocre win rate.
- Skipping the zero-division guard. A dataset where every hero shares one stat value (common early in a small patch) will crash
normalize()without theor 1.0fallback. - Hardcoding tier cutoffs. Fixed thresholds like "score above 0.8 is S-tier" break the moment the roster size or score distribution shifts.
- Committing every generated PNG without a size check. Skipping
optimize=Truequietly bloats your repository's history over dozens of patches. - Relying on a system font that doesn't exist on the CI runner. Ubuntu's GitHub-hosted runners don't ship every font you might have locally, so stick to Pillow's bundled default unless you commit a TTF file with the project.
- Trusting CSV data blindly. Trailing whitespace, stray commas, or a missing header row will produce a tier list that looks fine but ranks the wrong heroes.
Troubleshooting Guide
Most of the failures below split into two buckets: a mismatch between what a step expects and what actually landed in a file, or an environment difference between your laptop and the CI runner. Work through this list roughly in order the first time something breaks, since the first few entries catch the most common mistakes.
- "ModuleNotFoundError: No module named 'PIL'" – install the package as
pillow, notPIL; the import name and the package name differ. - "OSError: cannot open resource" on font load – you're pointing at a font path that doesn't exist in this environment; fall back to
ImageFont.load_default(). - Image renders but hero names are invisible – check that your fill color has enough contrast against the tier row's background color.
- The Action runs green but never commits – you skipped the
git config user.nameanduser.emailstep, which git requires before it will make a commit. - Tier boundaries look inverted or wrong – confirm your CSV columns are numeric, not strings; a stray quote character makes Python treat a stat as text and sort it incorrectly.
- Script works locally but fails in CI – pin the Python version with
actions/setup-pythoninstead of relying on whatever the runner ships by default. - Duplicate-looking heroes in the output – a trailing space in the name column in your CSV; the
.strip()call in Step 2 fixes this at the source. - Discord webhook returns a 401 or 404 – the secret name in your workflow doesn't match what's stored in repo settings, or the webhook was regenerated on the Discord side.
- PNG file size is much larger than expected – you're saving without
optimize=True, or the image dimensions are larger than needed for the row count.
Advanced Tips for Power Users
Add a --weights flag so you can experiment with different formulas without editing source. A support-heavy Deadlock player might want kill participation weighted higher than win rate, and letting the CLI accept --weights 0.4,0.3,0.3 makes that a one-line change instead of a code edit. Parse the flag with argparse's type= parameter to split and validate the string into three floats that sum to 1.0, and fail loudly with a clear error message if they don't, rather than silently producing a skewed ranking.
If you're building this out over a weekend, an AI coding assistant is a reasonable way to speed up the boilerplate around argument parsing or test scaffolding. According to the 2025 Stack Overflow Developer Survey, 84% of developers are using or planning to use AI tools in their workflow, and 51% of professional developers already use them daily. That's useful for generating variations on the Pillow layout code quickly, but the scoring formula itself is worth writing and testing by hand. It's the part of the project that actually encodes your opinion about how Deadlock heroes should be ranked.
Cache the raw stats fetch if you ever wire this up to a live API instead of a manually updated CSV. Hitting a third-party tracker's endpoint on every CI run, every few minutes, is a fast way to get rate-limited right before a patch you actually wanted fresh data for.
Consider adding an SVG export alongside the PNG if you want the tier list to scale cleanly on different screen sizes without generating multiple fixed-resolution images. Pillow doesn't produce SVG natively, but a lightweight string template is often enough for something this structured: five rows, a handful of text labels, no complex shapes to draw.
It's also worth logging each run's inputs alongside its outputs, not just the rankings themselves. If you're pulling win-rate data from a live source instead of a static CSV, saving a timestamped copy of the raw input next to the generated tier list means you can always answer "what data actually produced this exact ranking" months later, even if the upstream source changes its numbers retroactively.
Extending the Generator: Ideas for Your Next Iteration
Once the base pipeline works end to end, there's plenty of room to grow it without touching the core scoring logic. A few directions worth trying, roughly in order of how much new code each one takes:
- Per-lane tier lists. Some heroes perform very differently in an early lane matchup than in a late-game teamfight, so a single overall tier can hide that split.
- Historical trend lines. Plot a hero's score across the last five patches from your
history/folder to show whether a hero is climbing, falling, or holding steady. - A confidence indicator. Heroes with a small sample size (low pick rate) deserve a visual flag, since their win rate is statistically noisier than a heavily played hero's.
- Multi-format export. Add a Markdown table writer alongside the JSON output so the current tier list can drop straight into a README or wiki page.
- A static web viewer. A single HTML file that fetches
rankings.jsonclient-side can render an interactive, sortable table without needing a server at all.
Deadlock Tier List Tools Compared
| Tool | Data Source | Update Method | Best For |
|---|---|---|---|
| Generator (this guide) | Your stat feed (CSV/JSON) | Automated script + CI | Reproducible, patch-day reranking |
| Tier List Tracker | Manual, local only | Click to move a card | Personal notes per hero |
| Tier List Maker | Manual drag-and-drop + optional API | Drag cards, deploy static site | Sharing a personal opinion list |
| Tier List Voting App | Community votes | Wilson-score ranking from votes | Crowd-sourced consensus |
The Complete Working Project
Here's the full file structure once every step above is in place:
deadlock-tiergen/
├── .github/workflows/tierlist.yml
├── data/heroes.csv
├── history/
├── output/
│   ├── tierlist.png
│   └── rankings.json
├── docs/index.html
├── models.py
├── scoring.py
├── render.py
├── diff.py
├── notify.py
├── main.py
└── test_scoring.py
The full 38-hero roster for your data/heroes.csv should include: Abrams, Apollo, Bebop, Billy, Calico, Celeste, Dynamo, The Doorman, Drifter, Graves, Grey Talon, Haze, Holliday, Infernus, Ivy, Kelvin, Lady Geist, Lash, McGinnis, Mina, Mirage, Mo & Krill, Paige, Paradox, Pocket, Rem, Seven, Shiv, Sinclair, Victor, Vindicta, Viscous, Vyper, Warden, Wraith, Yamato, and Venator. Append a new row the moment Valve ships another hero and re-run main.py.
You'll need Pillow (see the Pillow package page and its documentation) and the standard library modules covered in the Python 3 docs. For the automation piece, the GitHub Actions documentation covers workflow syntax in more depth than this tutorial has room for, and the game itself is still listed as a playtest on its Steam page.
Related Coverage
- Deadlock Tier List Tracker: 38 Heroes, 12 Steps [2026]
- Deadlock Tier List Maker: 12 Steps, 30 Min [2026]
- Deadlock Tier List Voting App: 12 Steps, 60 Min [2026]
- Valorant vs Deadlock Ranks: 25 Tiers vs 66 Steps [2026]
- Apex Legends Tier List 2026: 28 Legends, 12-Step Tracker
Frequently Asked Questions
Is Deadlock out of playtest yet?
No. As of August 2026, Deadlock remains an invite-only playtest on Steam, though its hero pool has grown to 38 characters and Valve continues shipping balance patches at a steady pace.
Do I need to know Python to follow this tutorial?
Basic familiarity helps, but every function above is short and explained inline. If you can read a for-loop, you can follow along and adapt it.
Can I reuse this generator for a different game's tier list?
Yes. Swap the CSV columns and the hero roster, and the scoring, tier-assignment, and rendering logic works unchanged for any game with comparable win-rate style stats.
What's the advantage over just using a spreadsheet?
Reproducibility and automation. A spreadsheet formula is easy to break by accident; a tested script with version control gives you a history of exactly how the ranking changed and why, and it can run itself on a schedule.
Where do I get real Deadlock win-rate data to plug in?
Community stat trackers publish exportable win-rate and pick-rate numbers for the current patch. Since coverage and accuracy vary and Deadlock is still in active playtest, cross-check any source against a second one before trusting the output for anything more than casual ranking.
Can I use more than five tiers?
Yes. Change TIER_LABELS and the n=5 argument passed to statistics.quantiles to match however many tiers you want, then add a matching color to TIER_COLORS.
Will this break when Valve adds a new hero?
No. The roster is entirely data-driven from your CSV, so adding a hero is a matter of appending one row and re-running the script. Nothing in the scoring or rendering code references hero names directly.
How do I change the visual style of the generated image?
Edit the TIER_COLORS dictionary and the font size passed to ImageFont.load_default() in render_tierlist(). If you want a custom typeface, bundle a TTF file with the repo and load it with ImageFont.truetype() instead, since system fonts aren't guaranteed to exist on a CI runner.
How accurate is a formula-based ranking compared to pro-player consensus?
It depends entirely on the weights you choose and the quality of the input data. A formula built purely on win rate and pick rate captures the current playtest meta reasonably well, but it can't account for coordinated pro-level strategies, draft priority, or team composition synergies the way a professional player's read of the game can. Treat the generator's output as a solid statistical baseline to argue from, not a substitute for watching how top players are actually drafting.
Can I run this without GitHub Actions?
Yes. GitHub Actions is convenient because it's free for public repos and ties the automation directly to your data commits, but the underlying script is a plain Python CLI. A cron job on any always-on machine, or a scheduled task on a home server, calls python main.py the same way and produces the same output.